Four weeks ago I published a wave count on SET with two scenarios and one specific decision zone: 1,644 – 1,674. I said the level mattered more than the count, and that how price behaved there — not whether it got there — would be the real signal.
Price got there. This is the follow-up, including the part where I grade my own call.
What actually happened
SET climbed into the zone and tagged 1,657.55 on 21 July — inside the range I'd named, in its upper half. Then it was rejected: a slide to 1,587.29 on 30 July, about −4.2% off the high. It has since recovered to 1,623.64.
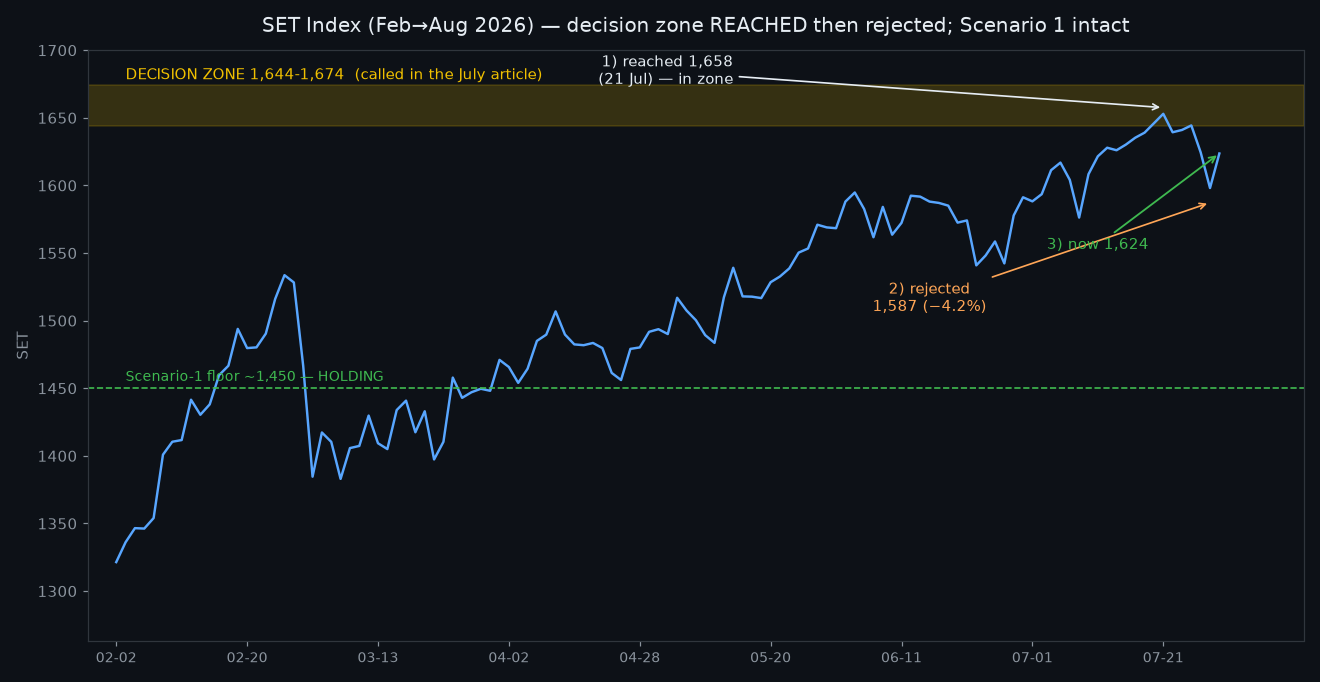
So the zone did what a decision zone is supposed to do: it produced resistance, and it produced a reaction. Now the useful question — which scenario is that reaction feeding?
The scorecard
| What I said in July | What happened | Verdict |
|---|---|---|
| Resistance in the 1,644–1,674 zone | Topped at 1,657.55, then rejected | Correct |
| Scenario 1: pull back but hold above ~1,450 | Pullback stopped at 1,587 — nowhere near 1,450 | Holding |
| Scenario 2: reverse hard, threaten the old lows | −4.2% and already recovering | Not triggered |
On the evidence so far, Scenario 1 is the live one. A −4.2% dip that finds buyers 137 points above the invalidation level is a shallow, healthy correction — which is precisely what Scenario 1 predicted. Scenario 2 required a hard reversal, and a 4% wobble isn't that.
The honest caveats
Three things keep this from being a victory lap.
First, it's early. The pullback is nine trading days old. Corrections can go sideways for weeks and still resolve either way. "Scenario 1 leading" is not "Scenario 1 confirmed."
Second, the zone hasn't actually been cleared. SET topped at 1,657 and sits at 1,623 — still below the zone, not above it. Scenario 1's full confirmation needs price to eventually take out 1,674 on the next attempt. Until then, this remains a rejection that held its floor, not a breakout.
Third — and I'll keep repeating this — none of this is a system signal. Everything else we publish is backtested. This wave count isn't, and our own Elliott-Wave-3 gate test was falsified: when we tried to turn wave counting into a mechanical rule, the edge we found came from the confirmed pullback low and a tight stop, not from the Elliott labels. So read this as a map of levels — system state — not as a reason to act.
What I'm watching next
- 1,674 — the top of the zone. A decisive close above it turns "held its floor" into "new leg."
- 1,587 — the pullback low. Losing it re-opens the Scenario 2 conversation.
- ~1,450 — the line that would actually invalidate Scenario 1. Comfortably far away right now.
Price is doing something narrower and more useful than either scenario's dramatic version: it reached the level, respected it, and held its support. That's a market building a base under resistance, and the resolution is worth waiting for rather than predicting.
*Update to the [5 July wave-count article](/articles/set-elliott-wave-scenarios-2026-07.html). Data through 31 July 2026. Subjective technical read — not backtested, not a signal, not investment advice.*